· モニタリングとロギング · 3 min read
Cloud Monitoring を使ったアラートとダッシュボードの作成
Google Cloud の監視ツールを活用した効果的なシステム監視と可視化の実践的ガイド
モニタリングの基本設定
Cloud Monitoring では、Google Cloud のリソースを自動的に監視し、メトリクスを収集します。効果的な監視を実現するための基本設定から説明します。
ワークスペースの設定
# モニタリングワークスペースの作成
gcloud monitoring workspaces create \
    --display-name="production-monitoring" \
    --location="asia-northeast1"
効果的なダッシュボードの作成
カスタムダッシュボード
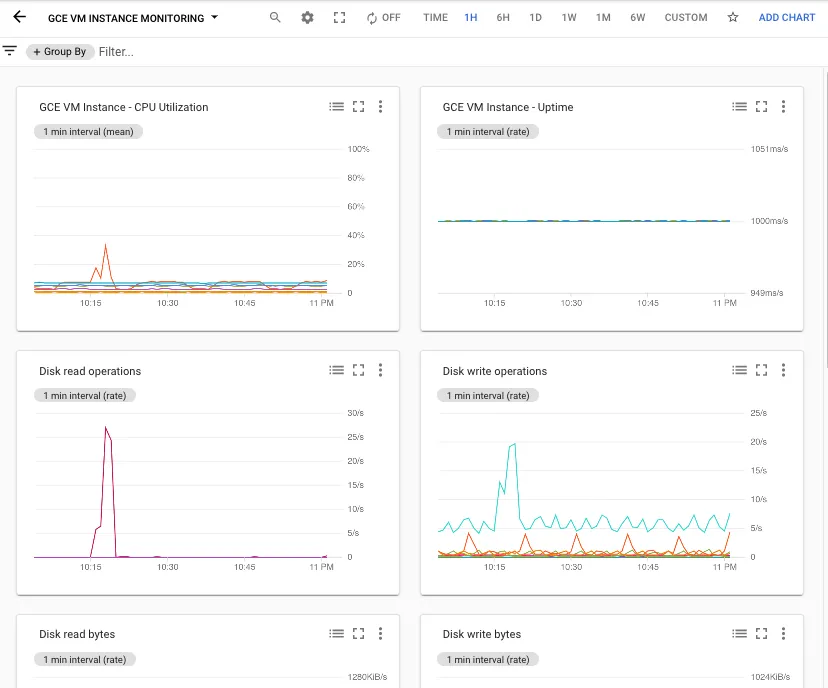
主要なメトリクスを含むダッシュボードの例:
- CPU使用率
- メモリ使用率
- ディスクI/O
- ネットワークトラフィック
- エラーレート
アプリケーション固有のメトリクス
from google.cloud import monitoring_v3

def create_metric_descriptor():
    client = monitoring_v3.MetricServiceClient()
    project_name = f"projects/{project_id}"

    descriptor = monitoring_v3.MetricDescriptor()
    descriptor.type = "custom.googleapis.com/users/active"
    descriptor.metric_kind = monitoring_v3.MetricDescriptor.MetricKind.GAUGE
    descriptor.value_type = monitoring_v3.MetricDescriptor.ValueType.INT64
    descriptor.description = "アクティブユーザー数"

    return client.create_metric_descriptor(
        name=project_name,
        metric_descriptor=descriptor
    )
アラート設定のベストプラクティス
インシデント管理
1. 検出フェーズ
- 🚨 アラート検出
- 🔍 緊急度評価
- 🚩 インシデント宣言
2. 初期対応フェーズ
- 👤 インシデントマネージャー任命
- 👥 対応チーム編成
- 📊 初期状況評価
3. 調査フェーズ
- 🔬 影響範囲の特定
- 🔍 根本原因分析
- 🔐 データ漏洩評価
4. 修復フェーズ
- 🛠️ 即時対策実施
- 📈 復旧計画の実行
- ✅ データ整合性の検証
5. 通知フェーズ
- 📢 ステークホルダーへの報告
- ⚖️ 法規制対応判断
- 📝 公式通知準備
6. 完了フェーズ
- 📁 インシデント文書化
- 🛡️ 再発防止策の策定
- 📚 教訓の共有
- 🏁 インシデントクローズ
注意: このプロセスは循環的であり、完了フェーズ後も継続的な改善と監視が必要です。
アラートポリシーの例
combiner: OR
conditions:
- conditionThreshold:
    comparison: COMPARISON_GT
    duration: 300s
    filter: metric.type="compute.googleapis.com/instance/cpu/utilization"
    thresholdValue: 0.8
displayName: High CPU Usage Alert
通知チャンネルの設定
- Eメール通知
- Slack連携
- PagerDuty連携
- Webhookによるカスタム通知
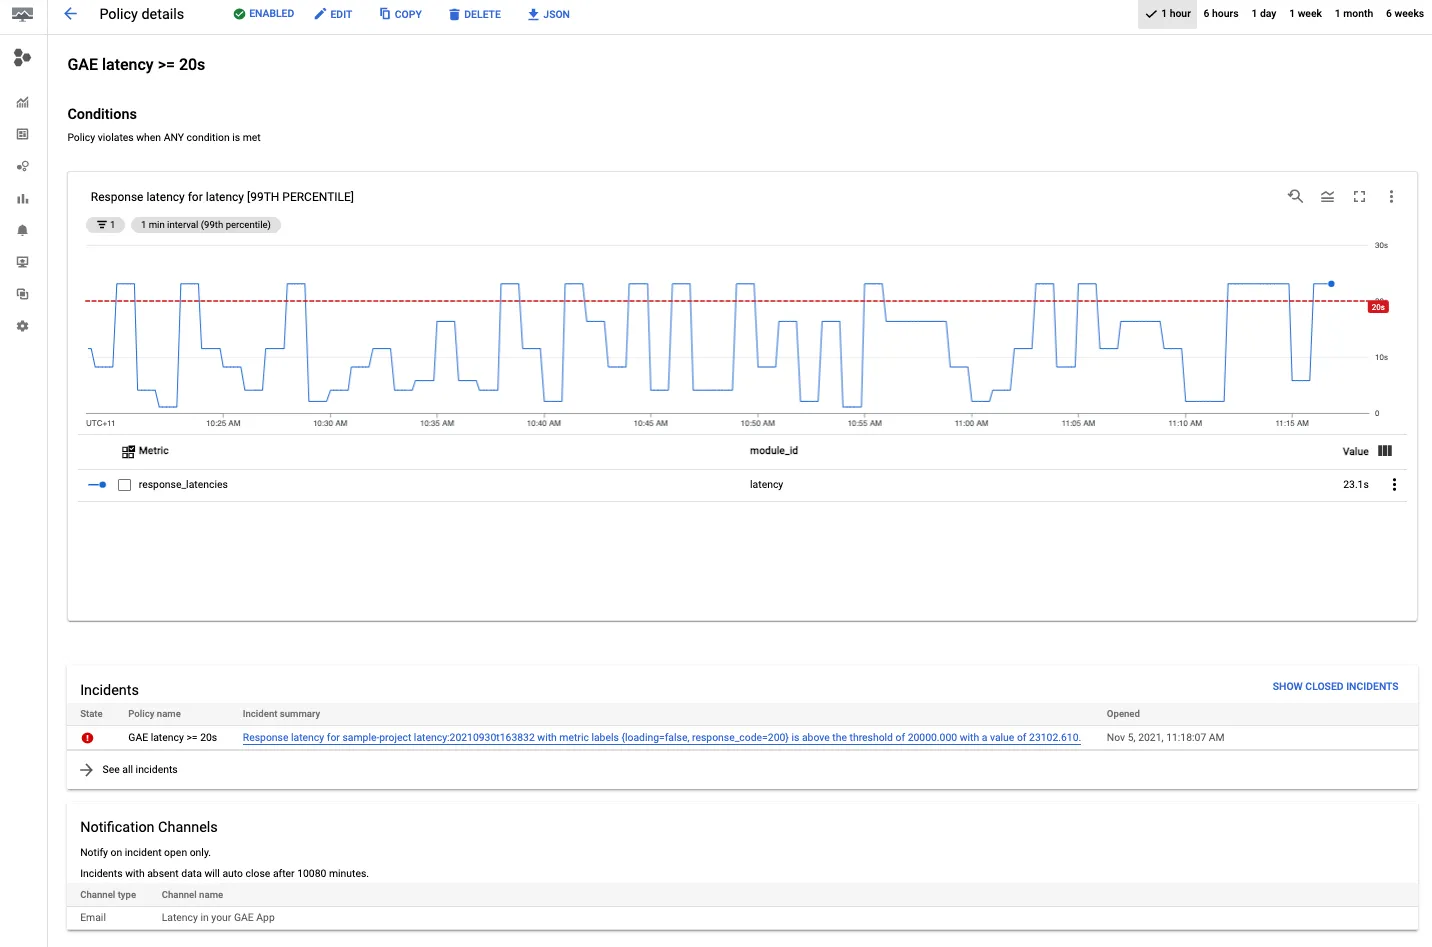
パフォーマンス分析
レイテンシモニタリング
キャパシティプランニング
def analyze_trends(metric_data):
    # トレンド分析のロジック
    trend = calculate_growth_rate(metric_data)
    forecast = predict_future_usage(trend)
    return forecast
📚 より詳しく学びたい方へ
「Google Cloud エンタープライズIT基盤設計ガイド」 https://amzn.to/47xFZZ9
トラブルシューティング
- メトリクス収集の問題
- アラート設定の調整
- ダッシュボードのパフォーマンス最適化
コスト最適化のためのモニタリング
- リソース使用率の監視
- 未使用リソースの特定
- コスト予測と予算アラート