· データ処理とワークフロー · 4 min read
Cloud Dataflow を使った ETL パイプラインの構築:実践ガイド
Google Cloud Dataflow を使用して効率的な ETL パイプラインを構築する方法を詳しく解説します

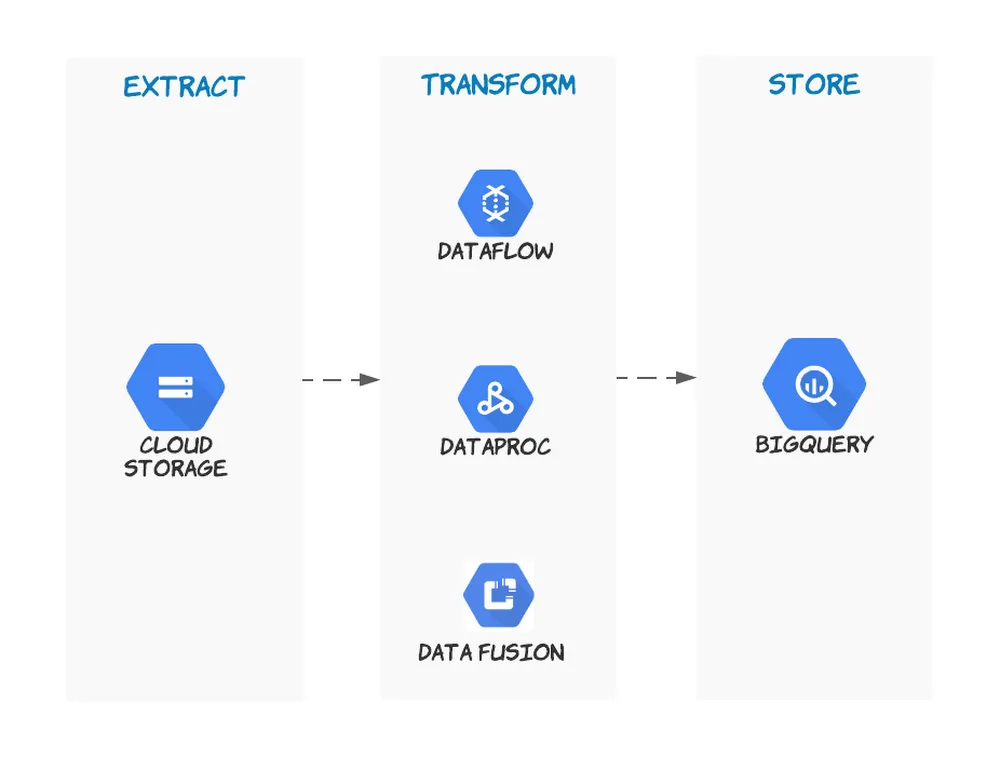
Cloud Dataflow による ETL 処理の現在位置
ETL パイプラインの実装方法は、この数年で大きく進化しています。特に Google Cloud の Dataflow は、以下の特徴により企業の ETL 処理の中心的な役割を担っています:
- サーバーレスで運用負荷を最小化
- Dataflow Prime による自動最適化
- ストリーミングとバッチの統合処理
- BigQuery や Pub/Sub との緊密な連携
- フルマネージドな監視と運用
実践的なユースケース
1. ログ分析パイプライン
複数のアプリケーションからのログを収集し、分析可能な形式に変換する例:
import apache_beam as beam
from apache_beam.options.pipeline_options import PipelineOptions

class LogParsingTransform(beam.DoFn):
    def process(self, element):
        try:
            # タイムスタンプ、ログレベル、メッセージの抽出
            parsed = json.loads(element)
            yield {
                'timestamp': parsed['timestamp'],
                'level': parsed['level'],
                'service': parsed['service'],
                'message': parsed['message'],
                'attributes': parsed.get('attributes', {})
            }
        except Exception as e:
            yield beam.pvalue.TaggedOutput('parsing_error', {
                'raw_message': element,
                'error': str(e)
            })

def run_pipeline():
    options = PipelineOptions()
    with beam.Pipeline(options=options) as p:
        # Pub/Sub からログを読み込み
        logs = (p
            | 'ReadLogs' >> beam.io.ReadFromPubSub(topic='projects/my-project/topics/logs')
            | 'ParseLogs' >> beam.ParDo(LogParsingTransform())
            | 'WindowByMinute' >> beam.WindowInto(window.FixedWindows(60))
        )

        # エラーログの検出と通知
        error_logs = (logs
            | 'FilterErrors' >> beam.Filter(lambda x: x['level'] == 'ERROR')
            | 'CreateAlerts' >> beam.ParDo(AlertGenerationFn())
        )

        # 集計とBigQueryへの書き込み
        (logs
            | 'AggregateByService' >> beam.GroupByKey('service')
            | 'WriteToBQ' >> beam.io.WriteToBigQuery(
                'project:dataset.logs_summary',
                schema=schema,
                write_disposition=beam.io.BigQueryDisposition.WRITE_APPEND
            )
        )
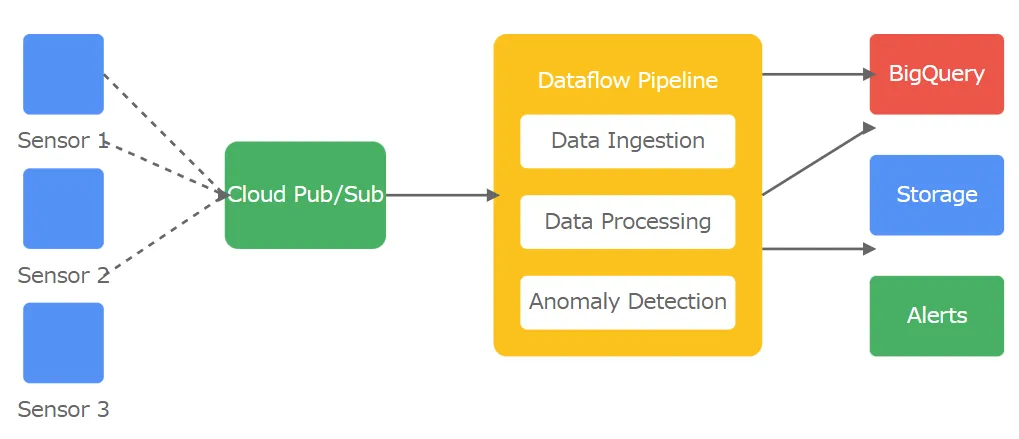
2. IoT データ処理パイプライン
センサーデータのリアルタイム処理と異常検知:
class SensorDataTransform(beam.DoFn):
    def setup(self):
        # ML モデルの初期化
        self.model = self.load_anomaly_detection_model()

    def process(self, element):
        # センサーデータの正規化
        normalized = self.normalize_data(element)

        # 異常検知
        if self.detect_anomaly(normalized):
            yield beam.pvalue.TaggedOutput('anomalies', normalized)

        yield normalized

def create_iot_pipeline(p, options):
    # センサーデータの読み込み
    raw_data = (p
        | 'ReadSensorData' >> beam.io.ReadFromPubSub(topic=options.input_topic)
        | 'ParseJSON' >> beam.Map(json.loads)
    )

    # データ処理とウィンドウ化
    processed_data = (raw_data
        | 'ProcessSensorData' >> beam.ParDo(SensorDataTransform())
        | 'WindowData' >> beam.WindowInto(
            window.SlidingWindows(
                size=60,  # 60秒のウィンドウ
                period=5  # 5秒ごとにスライド
            ))
    )
3. データウェアハウス更新パイプライン
複数ソースからのデータを統合し、データウェアハウスを更新:
class DataWarehouseUpdatePipeline:
    def __init__(self, options):
        self.options = options

    def create_pipeline(self):
        p = beam.Pipeline(options=self.options)

        # CRM データの読み込みと変換
        crm_data = (p
            | 'ReadCRM' >> beam.io.ReadFromAvro(self.options.crm_input)
            | 'TransformCRM' >> beam.ParDo(CRMTransform())
        )

        # 販売データの読み込みと変換
        sales_data = (p
            | 'ReadSales' >> beam.io.ReadFromParquet(self.options.sales_input)
            | 'TransformSales' >> beam.ParDo(SalesTransform())
        )

        # データの結合
        merged_data = ((crm_data, sales_data)
            | 'MergeData' >> beam.CoGroupByKey()
            | 'CreateDWRecord' >> beam.ParDo(DWRecordCreate())
        )

        return p
実装のベストプラクティス
テスト可能な設計
パイプラインのコンポーネントを独立してテスト可能に設計:
class DataTransform(beam.PTransform):
    def expand(self, pcoll):
        return (pcoll
            | 'Clean' >> beam.ParDo(DataCleaningFn())
            | 'Validate' >> beam.ParDo(DataValidationFn())
            | 'Transform' >> beam.ParDo(BusinessLogicFn())
        )

# ユニットテスト
def test_data_transform():
    with TestPipeline() as p:
        input_data = [{'id': '1', 'raw_value': ' 100 '}]
        output = (p
            | beam.Create(input_data)
            | DataTransform()
        )
        assert_that(output, equal_to([{'id': '1', 'value': 100}]))
エラー処理とリカバリ
堅牢なエラー処理とリカバリメカニズム:
class RobustTransform(beam.DoFn):
    def setup(self):
        self.retries = Metrics.counter('main', 'retry_count')

    @retry.with_exponential_backoff(
        num_retries=3,
        initial_delay_secs=1
    )
    def process_with_retry(self, element):
        try:
            result = self.transform_data(element)
            return result
        except TransientError as e:
            self.retries.inc()
            raise
        except PermanentError as e:
            yield beam.pvalue.TaggedOutput('permanent_errors', {
                'element': element,
                'error': str(e)
            })
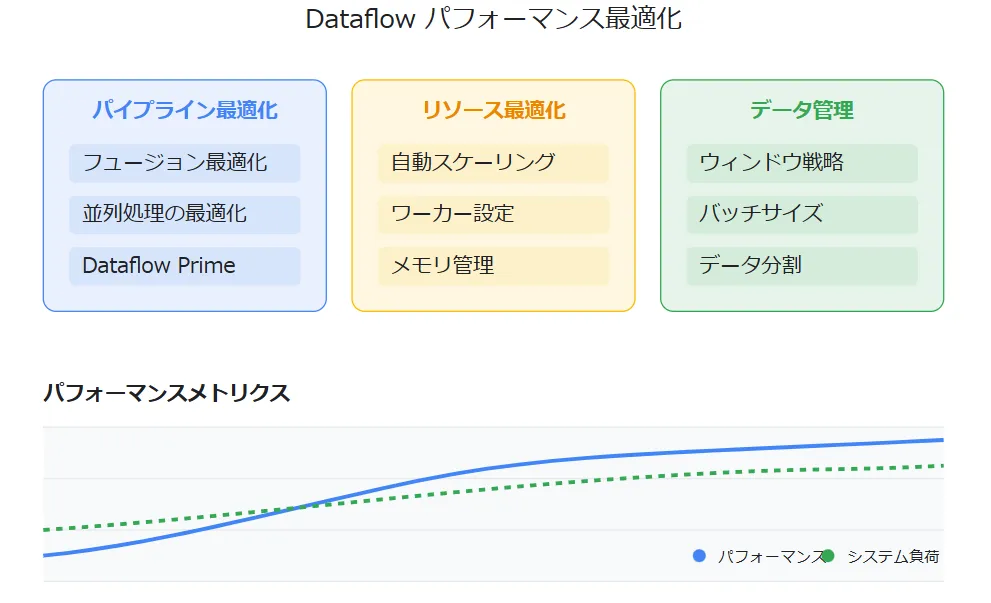
パフォーマンス最適化
Dataflow Prime を活用した最適化設定:
pipeline_options = PipelineOptions()
pipeline_options.view_as(DebugOptions).experiments = [
    'use_runner_v2',
    'prime_transform_support',
    'enable_streaming_engine'
]

pipeline_options.view_as(WorkerOptions).max_num_workers = 100
pipeline_options.view_as(WorkerOptions).autoscaling_algorithm = 'THROUGHPUT_BASED'
運用とモニタリング
メトリクスの可視化
Cloud Monitoring を使用した包括的なモニタリング:
class MonitoredTransform(beam.DoFn):
    def setup(self):
        self.elements_processed = Metrics.counter('monitoring', 'processed_elements')
        self.processing_time = Metrics.distribution('monitoring', 'processing_ms')
        self.element_sizes = Metrics.distribution('monitoring', 'element_sizes')

    def process(self, element):
        start = time.time()

        self.elements_processed.inc()
        self.element_sizes.update(len(str(element)))

        result = self.process_element(element)

        self.processing_time.update(
            int((time.time() - start) * 1000)
        )

        yield result
実践的な開発のために
ETL パイプライン開発の詳細について、以下の書籍が参考になります:
参考リンク
Share: